入门教程 pandas 文档 — pandas 3.0.0 文档 - pandas 数据分析库
pandas数据表表示
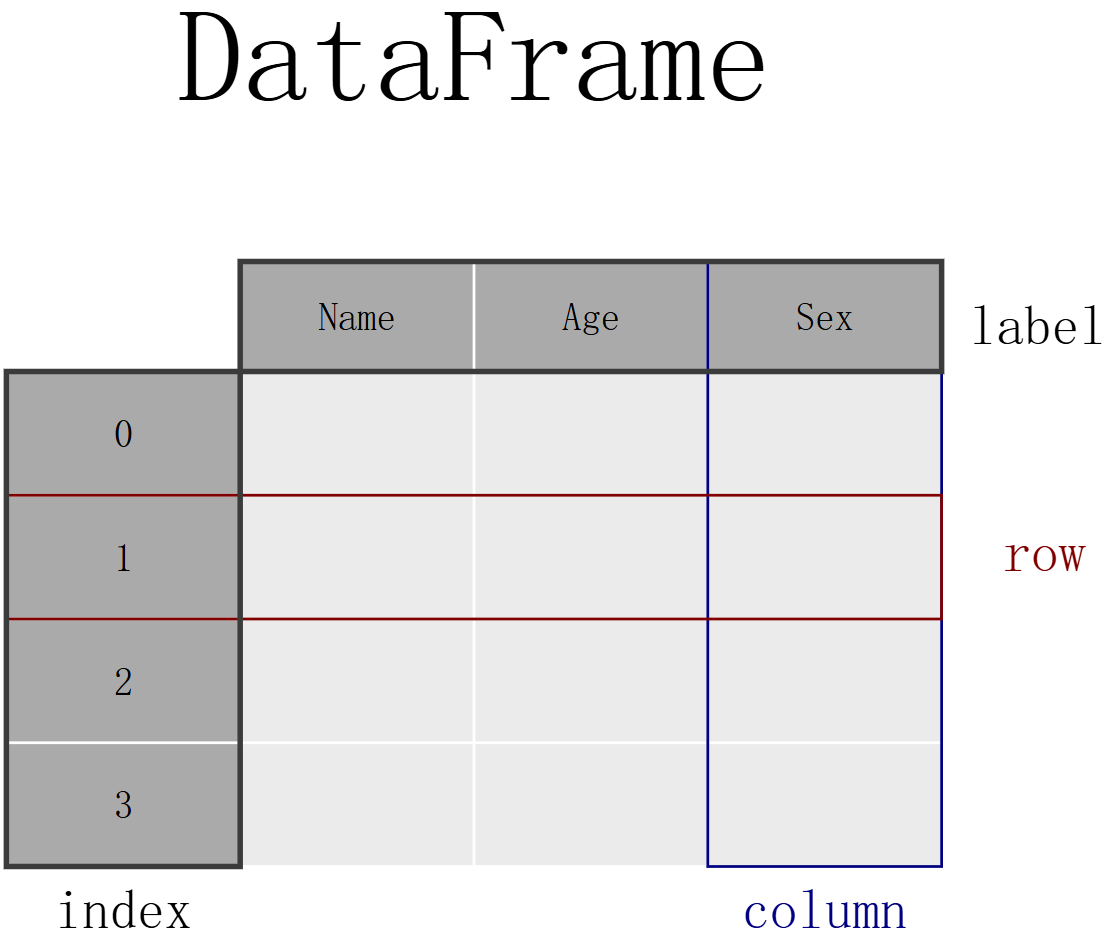
如果想存储泰坦尼克号的乘客数据。对于一些乘客,我知道他们的姓名(字符)、年龄(整数)和性别(男性/女性)数据,要手动将数据存储在表中,请创建一个 DataFrame。当使用列表的 Python 字典时,字典的键将用作列标题,每个列表中的值将用作 DataFrame 的列。
1
2
3
4
5
6
7
8
9
10
11
12
13
14
15
16
17
18
19
20
21
22
23
24
25
26
27
28
29
30
31
32
33
34
35
36
37
38
import pandas as pddf = pd.DataFrame( { "Name" : [ "Braund, Mr. Owen Harris" , "Allen, Mr. William Henry" , "Bonnell, Miss Elizabeth" , ], "Age" : [22 , 35 , 58 ], "Sex" : ["male" , "male" , "female" ], } ) ''' 一个 DataFrame 是一个二维数据结构,它可以在列中存储不同类型的数据(包括字符、整数、浮点数值、分类数据等)。它类似于电子表格、SQL 表 或 R 中的 data.frame。 该表有 3 列,每列都有一个列标签。列标签分别是 Name、Age 和 Sex。 列 Name 由文本数据组成,每个值都是一个字符串,列 Age 是数字,列 Sex 是文本数据。 索引标签表示每一行。默认情况下,这是一个从 0 开始的整数序列。 ''' print (df)print (df['Age' ])salary = pd.Series([1200 , 1320 , 1400 ], name="Salary" ) print (salary)print (df['Age' ].max ())print (salary.max ())print (df.describe())
注意
导入包,即 import pandas as pd
数据表存储为 pandas DataFrame
DataFrame 中的每一列都是一个 Series
您可以通过在 DataFrame 或 Series 上应用方法来执行操作。
如何读写表格数据 读取数据
写入数据
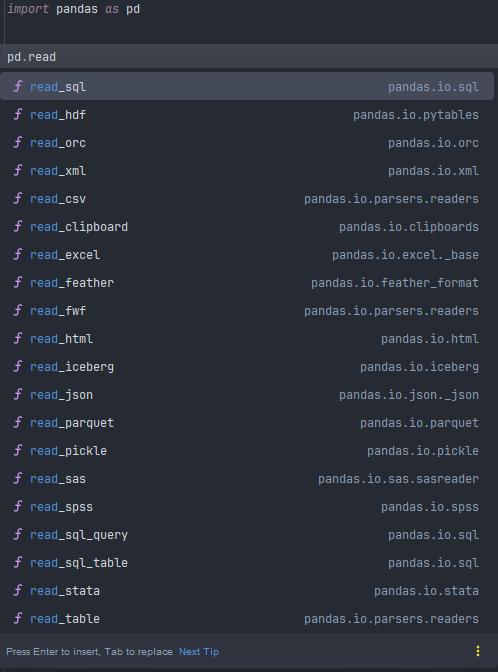
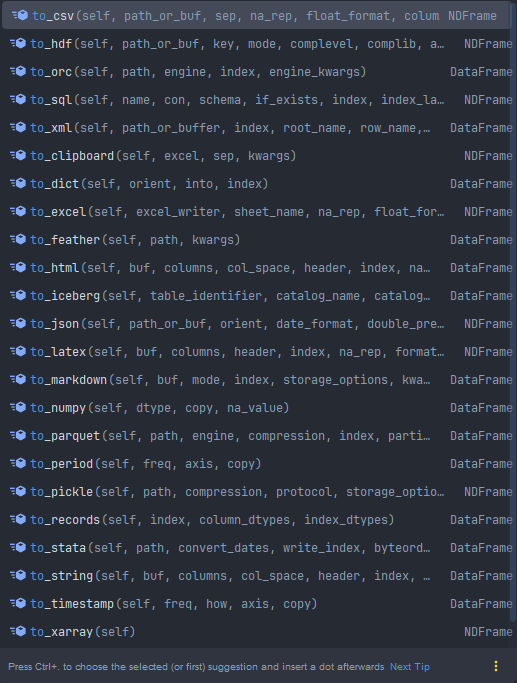
1
2
3
4
5
6
7
8
9
10
11
12
13
14
15
16
17
18
19
20
21
22
23
24
25
26
27
28
29
30
31
32
33
34
35
36
37
38
39
40
41
42
43
44
45
46
import pandas as pd''' 1. pandas 提供了 read_csv() 函数,用于将存储为 CSV 文件的数据读取到 pandas DataFrame 中。pandas 内置支持多种不同的文件格式或数据源 (csv、excel、sql、json、parquet 等),每种格式都带有 read_* 前缀。 读取数据后,请务必始终检查数据。默认情况下,显示 DataFrame 时,会显示前 5 行和后 5 行。 ''' train = pd.read_csv('data/train.csv' ) print (train)print (train.head(8 ))print (train.tail(10 ))''' 4. 通过请求 pandas 的 dtypes 属性,可以检查 pandas 如何解释每个列的数据类型 在请求 dtypes 时,不使用括号 ()!dtypes 是 DataFrame 和 Series 的一个属性。 DataFrame 或 Series 的属性不需要 ()。 属性表示 DataFrame/Series 的一个特征,而方法(需要括号 ())则会对 DataFrame/Series 执行某些操作,如在 第一个教程 中所述 ''' print (train.dtypes)''' 5. 将数据存为电子表格 whereas read_* 函数用于将数据读入 pandas,而 to_* 方法用于存储数据。 to_excel() 方法将数据存储为 Excel 文件。在此示例中, sheet_name 被命名为 trains,而不是默认的 Sheet1。通过设置 index=False,行索引标签不会保存在电子表格中。 ''' train.to_excel("data/train.xlsx" , sheet_name="trains" , index=False ) train_excel = pd.read_excel("data/train.xlsx" , sheet_name="trains" ) print (train_excel.head(8 ))''' 6. DataFrame 的技术摘要 info() 方法提供了有关 DataFrame 的技术信息,让我们详细解释其输出。 它确实是一个 DataFrame。 有 891 条条目,即 891 行。 每一行都有一个行标签(也称为 index),其值范围从 0 到 890。 该表有 12 列。大多数列对于每一行都有一个值(所有 891 个值都是 non-null)。有些列确实存在缺失值,其 non-null 值少于 891 个。 Name、Sex、Cabin 和 Embarked 列包含文本数据(字符串,也称为 object)。其他列是数值数据,其中一些是整数(integer),另一些是实数(float)。 不同列中数据的类型(字符、整数等)通过列出 dtypes 来进行总结。 还提供了保存 DataFrame 所需的大致 RAM 数量。 ''' print (train.info())
注意
通过 read_* 函数,可以从多种不同的文件格式或数据源获取数据到 pandas。
通过不同的 to_* 方法,可以将数据导出出 pandas。
head/tail/info 方法和 dtypes 属性对于初步检查非常方便。
如何选择 DataFrame 的子集 选择特定列 1 2 3 4 5 6 7 8 9 10 11 12 13 14 15 16 17 18 19 20 21 22 23 24 25 26 27 28 29 30 31 32 33 import pandas as pdtrain = pd.read_csv('data/train.csv' ) print (train.head())ages = train['Age' ] print (ages.head())print ('=' * 60 )print (type (ages.head()))print ('=' * 60 )print (f"ages.shape: {ages.shape} " )print (f"train.shape: {train.shape} " )print ('=' * 60 )''' 3. 年龄和性别 要选择多列,请在选择方括号 [] 中使用列名列表, 返回的数据类型是 pandas DataFrame 内部方括号定义了一个带有列名的 Python 列表,而外部方括号用于从 pandas DataFrame 中选择数据,如前一示例所示。 ''' age_sex = train[['Age' , 'Sex' ]] print (age_sex)print (age_sex.shape)print (type (age_sex))
过滤特定行 注意
组合多个条件语句时,每个条件都必须用括号 () 括起来。此外,不能使用 or/and,而必须使用 or 运算符 | 和 and 运算符 &
1 2 3 4 5 6 7 8 9 10 11 12 13 14 15 16 17 18 19 20 21 22 23 24 25 26 27 28 29 30 31 32 33 34 35 import pandas as pd''' 1. 筛选条件1种,年龄大于 35 岁的乘客 在 pandas 中,train[train['Age'] > 35] 这种写法是布尔索引(Boolean Indexing),它能够正确筛选出年龄大于 35 的行。其原理是: train['Age'] > 35 会返回一个布尔型 Series,长度与原 DataFrame 相同,每个元素对应一行是否满足条件(True 表示满足,False 表示不满足)。 将这个布尔 Series 放入 train[] 中,pandas 就会保留所有 True 对应的行,从而完成筛选。 ''' above_35 = train[train['Age' ] > 35 ] print (above_35)print ('=' * 60 )above_35_male = train.query('Age > 35 and Sex == "male"' ) print (above_35_male)print ('=' * 60 )''' 3. 筛选条件1种内的多个值,乘客的 2 等和 3 等舱 与条件表达式类似,isin() 条件函数返回一个 True,表示其值在提供的列表中。要根据此类函数过滤行,请在选择方括号 [] 中使用条件函数。 在本例中,选择方括号 titanic["Pclass"].isin([2, 3]) 中的条件会检查 Pclass 列的值为 2 或 3 的行。 以上等同于按 2 等或 3 等的行进行过滤,并将两个语句用 |(或)运算符组合起来 class_23 = titanic[(titanic["Pclass"] == 2) | (titanic["Pclass"] == 3)] ''' pclass_2_3 = train[train['Pclass' ].isin([2 , 3 ])] print (pclass_2_3)print ('=' * 60 )''' 4. 年龄已知乘客的数据 notna() 条件函数返回一个 True,表示其值不是 Null 值的行。因此,这可以与选择方括号 [] 结合使用来过滤数据表 ''' age_no_na = train[train['Age' ].notna()] print (age_no_na)
选择特定行和列 注意
选择数据子集时,使用方括号 []。
在这些方括号内,您可以使用单个列/行标签、标签列表、标签切片、条件表达式或冒号。
使用 loc 进行基于标签的选择(使用行/列名称)。
使用 iloc 进行基于位置的选择(使用表格位置)。
您可以根据 loc/iloc 为选定的数据分配新值。
特性
.loc
.iloc
索引方式 基于标签 (index 和 column 的名字)基于整数位置 (从 0 开始的顺序位置)
切片包含右端点吗 包含 ('A':'C' 会包括 'C')不包含 (0:3 只取位置 0,1,2)
支持布尔数组 支持(常用于条件筛选)
不支持(传入布尔数组会报错)
越界处理 标签不存在则报错 KeyError
位置越界报错 IndexError
适用场景 按行/列名、条件筛选、含标签的切片
按位置取前 n 行/列、数字切片、整数索引的 DataFrame
1 2 3 4 5 6 7 8 9 10 11 12 13 14 15 16 17 18 19 20 21 22 23 24 25 26 27 28 29 30 31 32 33 34 35 36 37 38 39 40 import pandas as pd''' 1.年龄大于 35 岁的乘客姓名、性别、舱等级 在这种情况下,一次性选取了行和列的子集,仅使用选择方括号 [] 已经不够了。需要在选择方括号 [] 前使用 loc/iloc 运算符。 当使用 loc/iloc 时,逗号前的部分是您想要的行,逗号后的部分是您要选择的列。 当使用列名、行标签或条件表达式时,请在选择方括号 [] 前使用 loc 运算符。对于逗号之前和之后的部分, 您可以使用单个标签、标签列表、标签切片、条件表达式或冒号。使用冒号表示您要选择所有行或列。 ''' above_35_name_sex_class = train.loc[train['Age' ] > 35 , ['Name' , 'Sex' , 'Pclass' ]] print (above_35_name_sex_class)print (above_35_name_sex_class.shape)print (type (above_35_name_sex_class))print ('=' * 60 )above_35_name_sex_class = train.query('Age > 35 and Sex == "male" and Pclass == 2' )["Name" ] print (above_35_name_sex_class)print ('=' * 30 )mask = (train['Age' ] > 35 ) & (train['Sex' ] == 'male' ) & (train['Pclass' ] == 2 ) above_35_name_sex_class = train.loc[mask, "Name" ] print (above_35_name_sex_class)print (above_35_name_sex_class.shape)print (type (above_35_name_sex_class))print ('=' * 60 )row_10_25_col_3_5 = train.iloc[9 :25 , 2 :5 ] print (row_10_25_col_3_5)print ('=' * 60 )print (train.iloc[:5 , 3 ])train.iloc[0 :3 , 3 ] = "anonymous" print (train.iloc[:5 , 3 ])
如何在 pandas 中创建绘图 请记住
.plot.* 方法适用于 Series 和 DataFrame。
默认情况下,每个列都将作为不同的元素(折线、箱线图等)进行绘制。
pandas 创建的任何绘图都是 Matplotlib 对象。
plot支持绘图类型:area、bar、barh、box、density、hexbin、hist、kde、line、pie、scatter
1 2 3 4 5 6 7 8 9 10 11 12 13 14 15 16 17 18 19 20 21 22 23 24 25 26 27 28 29 30 31 32 33 34 35 36 37 38 39 40 41 42 43 44 45 46 47 48 49 50 51 52 53 54 55 56 57 58 59 import pandas as pdimport matplotlib.pyplot as pltair_quality = pd.read_csv('data/air_quality_no2.csv' , index_col=0 , parse_dates=True ) print (air_quality.head(5 ))air_quality.plot() plt.show() print ('=' * 60 )air_quality['station_paris' ].plot() plt.show() print ('=' * 60 )air_quality.plot.scatter(x="station_london" , y="station_paris" , alpha=0.5 ) plt.show() print ('=' * 60 )for method_name in dir (air_quality.plot): if not method_name.startswith("_" ): print (method_name) ''' area bar barh box density hexbin hist kde line pie scatter ''' print ('=' * 60 )air_quality.plot.box() plt.show() print ('=' * 60 )air_quality.plot.area(figsize=(12 , 4 ), subplots=True ) plt.show() print ('=' * 60 )fig, axs = plt.subplots(figsize=(12 , 4 )) air_quality.plot.area(ax=axs) axs.set_ylabel("NO$_2$ concentration" ) fig.savefig("no2_concentrations.png" ) plt.show()
如何创建由现有列派生出的新列 注意
通过将输出分配给 DataFrame,在新列名上加上 [] 来创建新列。
操作是逐元素的,无需迭代行。
使用 rename 结合字典或函数来重命名行标签或列名。
1
2
3
4
5
6
7
8
9
10
11
12
13
14
15
16
17
18
19
20
21
22
23
24
25
26
27
28
29
30
31
32
33
34
35
36
37
38
39
40
import pandas as pdair_quality = pd.read_csv("data/air_quality_no2.csv" , index_col=0 , parse_dates=True ) print (air_quality.head())print ('=' * 60 )''' 1. 创建新列,请使用方括号 [],并将新列名放在赋值的左侧 将伦敦监测站的浓度表示为 mg/m。 (*假设温度为 25 摄氏度,压力为 1013 hPa,转换系数为 1.882*) ''' air_quality['london_mg_per_cubic' ] = air_quality['station_london' ] * 1.882 print (air_quality.head())print ('=' * 60 )air_quality['ratio_paris_antwerp' ] = (air_quality['station_paris' ] / air_quality['station_antwerp' ]) print (air_quality.head())print ('=' * 60 )air_quality_renamed = air_quality.rename( columns={ "station_antwerp" : "BETR801" , "station_paris" : "FR04014" , "station_london" : "London Westminster" , } ) print (air_quality_renamed.head())print ('=' * 30 )air_quality_renamed = air_quality_renamed.rename(columns=str .lower) print (air_quality_renamed.head())print ('=' * 30 )air_quality_renamed = air_quality_renamed.rename(columns=str .upper) print (air_quality_renamed.head())
如何计算汇总统计数据 汇总统计信息 1 2 3 4 5 6 7 8 9 10 11 12 13 14 15 16 17 18 19 20 21 22 23 24 25 26 import pandas as pdtitanic = pd.read_csv('data/titanic.csv' ) print (titanic.head())print (titanic['Age' ].mean())print (titanic['Age' ].min ())print (titanic['Age' ].max ())print ('=' * 60 )print (titanic[['Age' , 'Fare' ]].median())print ('=' * 30 )print (titanic[['Age' , 'Fare' ]].describe())print ('=' * 30 )print (titanic.agg( { 'Age' : ['min' , 'max' , 'median' , 'skew' ], 'Fare' : ['min' , 'max' , 'median' , 'mean' ], } ))
按类别汇总统计信息 1 2 3 4 5 6 7 8 9 10 11 12 13 14 15 16 17 18 19 20 21 22 23 24 25 26 27 28 29 30 import pandas as pdtitanic = pd.read_csv('data/titanic.csv' ) print (titanic[['Sex' , 'Age' ]].groupby('Sex' ).mean())print ('=' * 30 )print (titanic[['Pclass' , 'Age' ]].groupby('Pclass' ).mean())print ('=' * 30 )print (titanic[['Pclass' , 'Age' ]].groupby('Pclass' ).size().to_frame(name='Count' ))print ('下面的统计方法使用的是count,统计每组非空值个数,返回 DataFrame;上面使用size,统计每组总行数(包括 NaN),返回 Series' )print (titanic[['Pclass' , 'Age' ]].groupby('Pclass' ).count().rename(columns={'Age' : 'Count' }))print ('=' * 60 )print (titanic.groupby(['Sex' , 'Pclass' ])['Fare' ].mean())print ('=' * 30 )print (type (titanic.groupby(['Pclass' , 'Sex' ])['Fare' ].mean()))print (titanic.groupby(['Pclass' , 'Sex' ])['Fare' ].mean().to_frame(name="Average Price" ))
按类别计算记录数 注意
可以对整个列或行计算聚合统计信息。
groupby 提供了split-apply-combine 模式的强大功能。
value_counts 是一个方便的快捷方式,用于计算变量每个类别中的条目数。
可以使用 size 和 count 结合 groupby 使用。其中 size 包括 NaN 值并仅提供行数(表的大小),而 count 则排除缺失值。在 value_counts 方法中,使用 dropna 参数来包含或排除 NaN 值。
1
2
3
4
5
6
7
8
9
10
11
import pandas as pdtitanic = pd.read_csv('data/titanic.csv' ) print (titanic['Pclass' ].value_counts())print ('=' * 30 )print (titanic.groupby("Pclass" )["Pclass" ].count())